![]() The U.S. unemployment rate dropped sharply in January to 9.0 percent, but the economy added only 36,000 non-farm jobs during the month, the smallest number in months.
The U.S. unemployment rate dropped sharply in January to 9.0 percent, but the economy added only 36,000 non-farm jobs during the month, the smallest number in months.
The monthly jobs report from the U.S. Labor Department released this morning also included the annual revision of jobs numbers, which showed the economy created 162,000 fewer jobs since February 2010 than had originally been reported.
The January jobs count was far below the various consensus estimates that were mostly in the 140,000 to 148,000 range. Some economists had upped their predictions following Wednesday’s bullish report from ADP of 187,000 private sector jobs added during the month.
 But the government report said the private sector produced only 50,000 new jobs in January, a number offset by the continuing decline in government employment. State and federal payrolls shed 4,000 workers, while local government cut 10,000 jobs.
Speculation is that the fierce winter weather in much of the country not only kept workers away from the office, but dampened any hiring plans. The Monster Employment Index for January, also released this morning, dipped eight points from December to 122. The Index measures the number of jobs advertised online across the country, collecting the counts from multiple sites, not just from Monster.
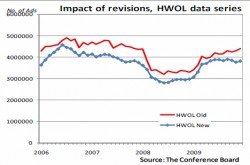
Demonstrating the conflicting nature of much of the jobs data, The Conference Board’s Help-Wanted Online Index took its biggest jump in its six-year history, claiming 438,000 more jobs were advertised in January than in  December. However The Conference Board’s release included sharp revisions to its entire data set, which reduced the monthly job counts by about 200,000. The adjustments significantly changed the job ad trend for the last six months. Instead of job ads growing, The Conference Board now says job ads were shrinking.
In any case, the various, and often conflicting, labor data, tells a story of uncertainty. Even what should be good news about unemployment from the Bureau of Labor Statistics is tinged with questions. According to today’s report, there were 600,000 fewer unemployed workers in January, which caused the precipitous drop in the unemployment rate.
The unemployment number and demographic data related to employment is determined by surveys completed by households across the U.S. Job counts are determined by surveys of employers. The results of the two surveys at times such as now seems inconsistent. Over the months, though, trends are clear.
But within the so-called Household Survey the report generally showed improvement. The number of people working part-time because they couldn’t find full-time work declined from 8.9 million to 8.4 million. With the labor force numbers holding steady, the implication is that these individuals found other work, rather than just dropped out of the labor force.
Also declining were the number of long-term unemployed, which declined slightly to 6.2 million. But the number of those considered “marginally attached” to the labor force grew by 300,000 to 2.8 million. To be counted in this group an individual must have looked for work in the preceding 12 months, but not during the preceding four weeks, nor did they have a job during the survey period.
In terms of job growth, manufacturing added the most (49,000) and retail added 28,000. Construction was the big losing, shedding 32,000 jobs, probably a direct result of the weather.